Help centerPhotos and AI analysis
How the AI analyzes your photos
What happens after you start analysis: coral detection, stress heatmaps, area and coverage.
Follow the analysis
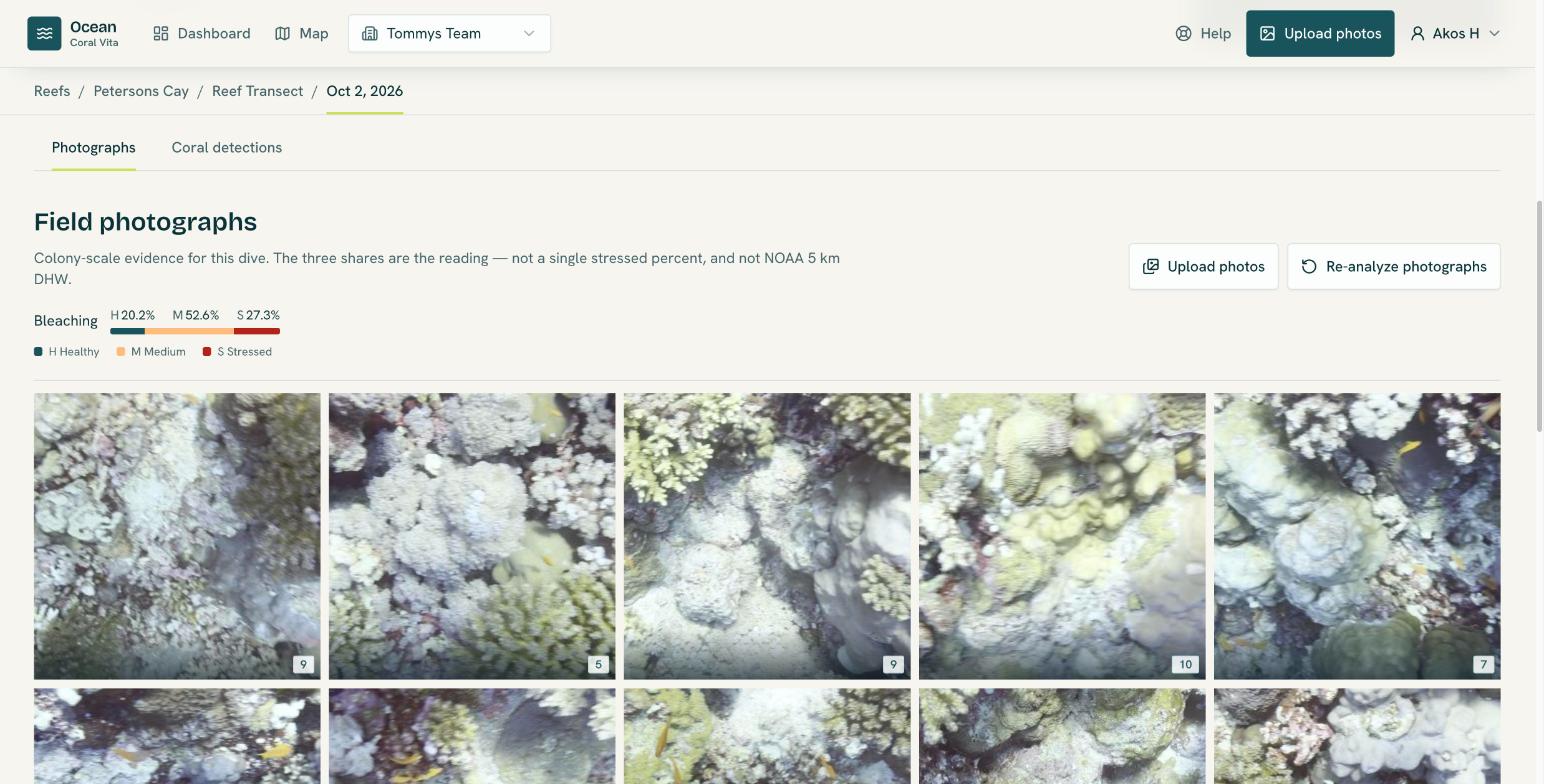
When you start analysis, each photo is sent to Ocean's analysis pipeline. On the survey's Photographs tab, photos move from Not analyzed to Reading while the pipeline works on them, and then show the number of corals found. A photo that couldn't be read shows Failed.
A Reading photographs notice counts photos waiting, reading and done, and Ocean tells you when the run is complete. You can keep working elsewhere in the meantime.
What the AI finds
For every photo, the AI finds each coral colony and records:
- its outline on the photo and a cut-out image of the colony;
- a confidence score: how sure the model is that this is a coral colony;
- its area in pixels and, when it can be measured, in cm²;
- a suggested identification;
- a stress heatmap classifying every pixel of the colony (see below).
The stress heatmap
Healthy coral tissue gets much of its colour from the algae living in it. When corals bleach they lose that colour. The pipeline compares the colour and brightness of every pixel inside a colony, using settings tuned for the coral's type, and classifies it as Healthy, Medium or Stressed. The heatmap paints those classes over the colony: green for healthy, yellow for medium and red for stressed. Elsewhere in Ocean the same three classes are shown in teal, peach and red.
Every bleaching number in Ocean is built from these pixel counts. See Bleaching and coral metrics.
Colony area and coral coverage
Colony area in cm² is measured using the 2×2 ArUco markers in the photo. Colonies that can't be measured still get detections and bleaching readings, and show Not measured for area. The survey's mean colony size only uses measured colonies, so unlike total area it doesn't grow with the number of photos.
Live coral coverage is the share of photographed pixels that fall inside coral detections: coral pixels ÷ photo pixels × 100, capped at 100% because outlines can overlap. It appears once every photo in the survey is analyzed.
Recalculation after identification
The heatmap settings depend on the kind of coral. When your organization has heatmap recalculation turned on, changing a coral's growth form, genus or species rescores its heatmap with the matching settings. Ocean shows that it is recalculating, then tells you whether the result changed.
Branching, digitate and corymbose corals such as Acropora grow from pale tips that naturally carry less colour than the tissue behind them. For these growth forms, Ocean repaints small pale patches surrounded by healthy tissue as healthy, and tells you how many pixels changed (Pale branch tips counted as healthy).
Every recalculation is kept: the newest result is the one Ocean uses, and earlier ones stay on record.
Re-analyze a survey
Re-analyze photographs on the Photographs tab starts a new analysis run for every photo. The previous detections stay visible until the new run finishes, and the survey's results then switch to the newest run.