Help centerReading the data
Dashboard, site and survey pages
Find, filter and compare reefs, sites and surveys, and read the site trend and the map heatmap.
The dashboard
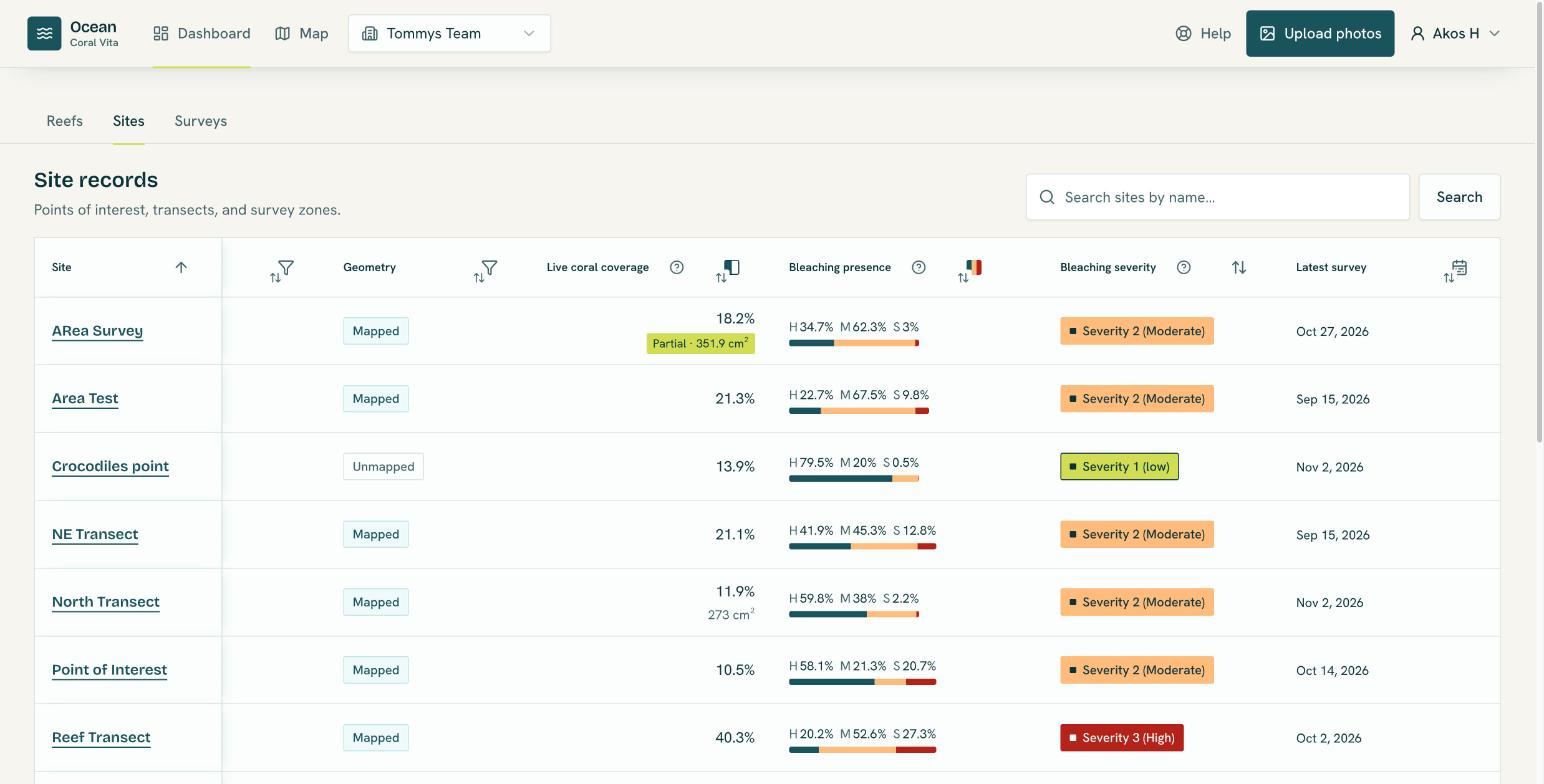
The Dashboard has a tab each for Reefs, Sites and Surveys. Every tab has a search box (the Surveys tab searches by site name), column filters, sorting, and 25, 50 or 100 rows per page.
- Reefs: live coral coverage, bleaching presence, latest survey, habitat (zone, profile, exposure, type, depth) and whether the boundary is mapped.
- Sites: reef, site type, whether the location is mapped, live coral coverage, bleaching presence, bleaching severity and latest survey.
- Surveys: survey date, site, reef, site type, live coral coverage and bleaching presence.
Select a column heading to sort by it or open its filter. Habitat filters include Not recorded so you can find reefs that still need habitat.
The site page
Bleaching trend
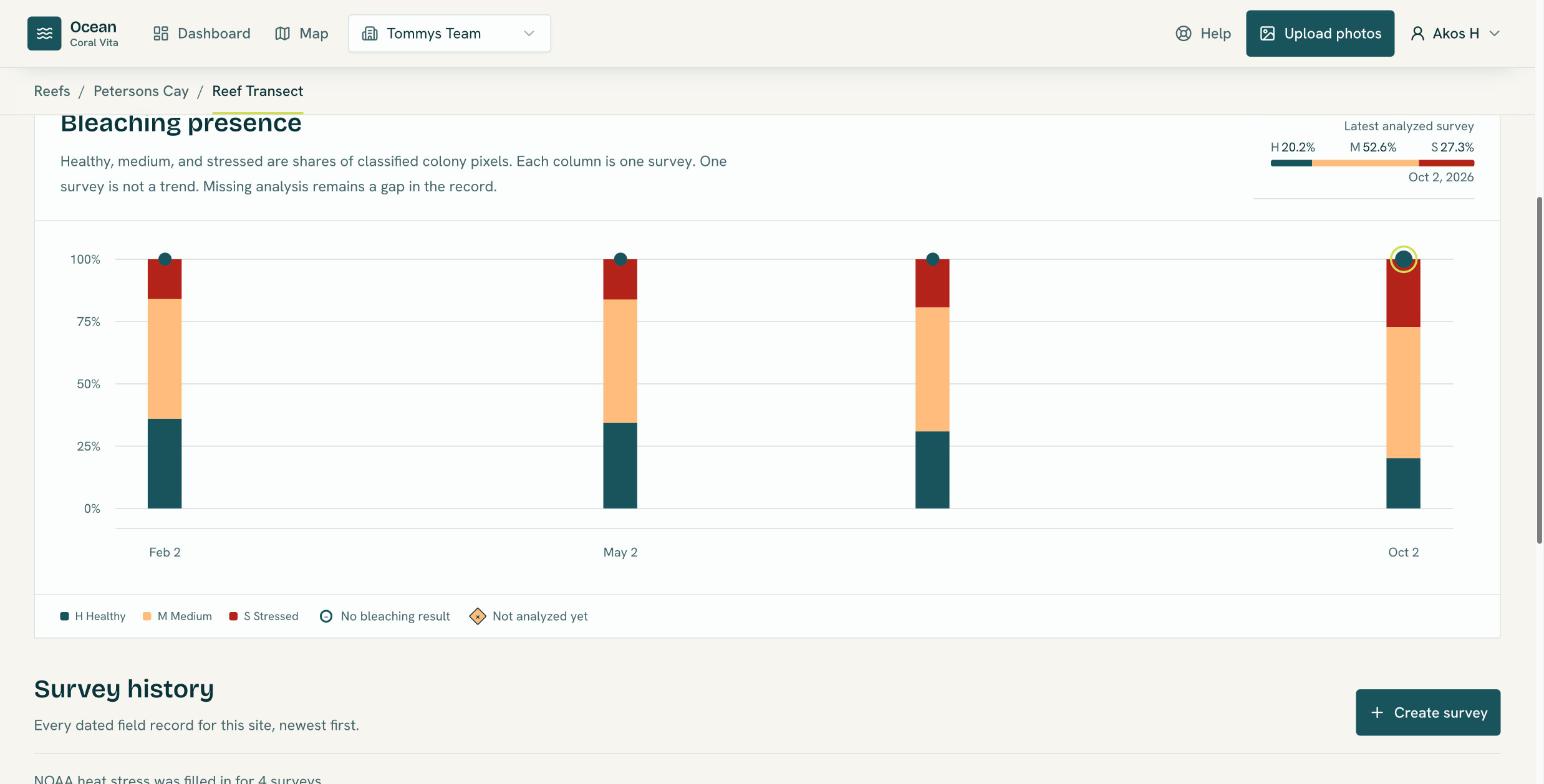
The Bleaching presence chart has one stacked column per survey showing its healthy, medium and stressed shares, oldest to newest. Surveys without a result are marked below the 0% line, so a gap is never mistaken for healthy coral. One survey is not a trend: compare several before drawing conclusions.
Survey history
Below the chart, Survey history lists every survey, newest first, with coverage, colony size, bleaching presence and severity, NOAA degree heating weeks and alert level, analysis status and photo count. Filter it to, for example, surveys under a Bleaching Alert, or surveys not analyzed yet.
The survey page
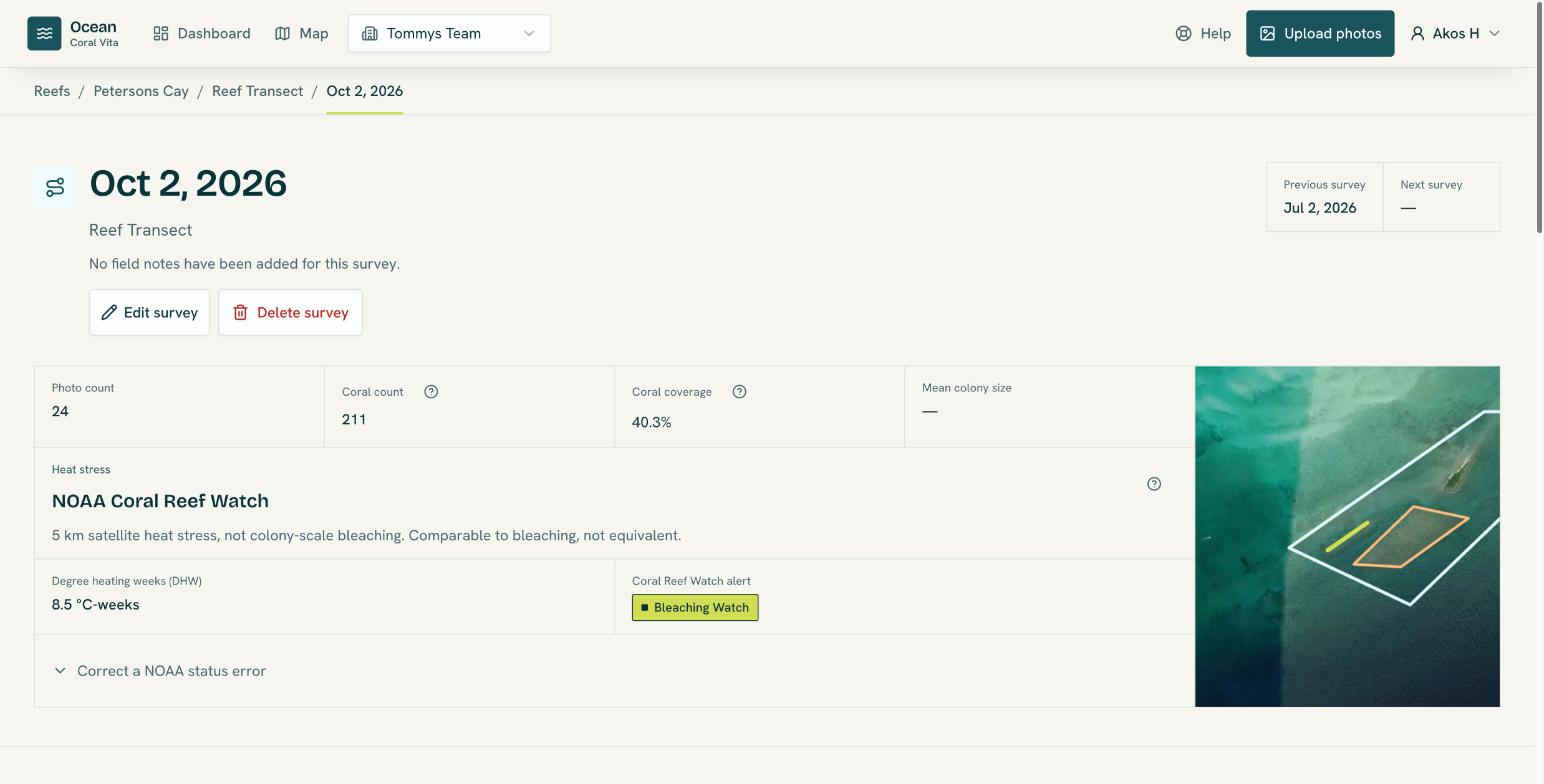
The survey page's facts panel shows the reef and site, the Previous survey and Next survey at the same site (select them to step through the site's history), photo and coral counts, coral coverage, mean colony size, and NOAA heat stress. Below it, the Photographs tab holds the photos and their analysis, and Coral detections lists every colony.
See Review coral detections for the photo and colony views.
The map
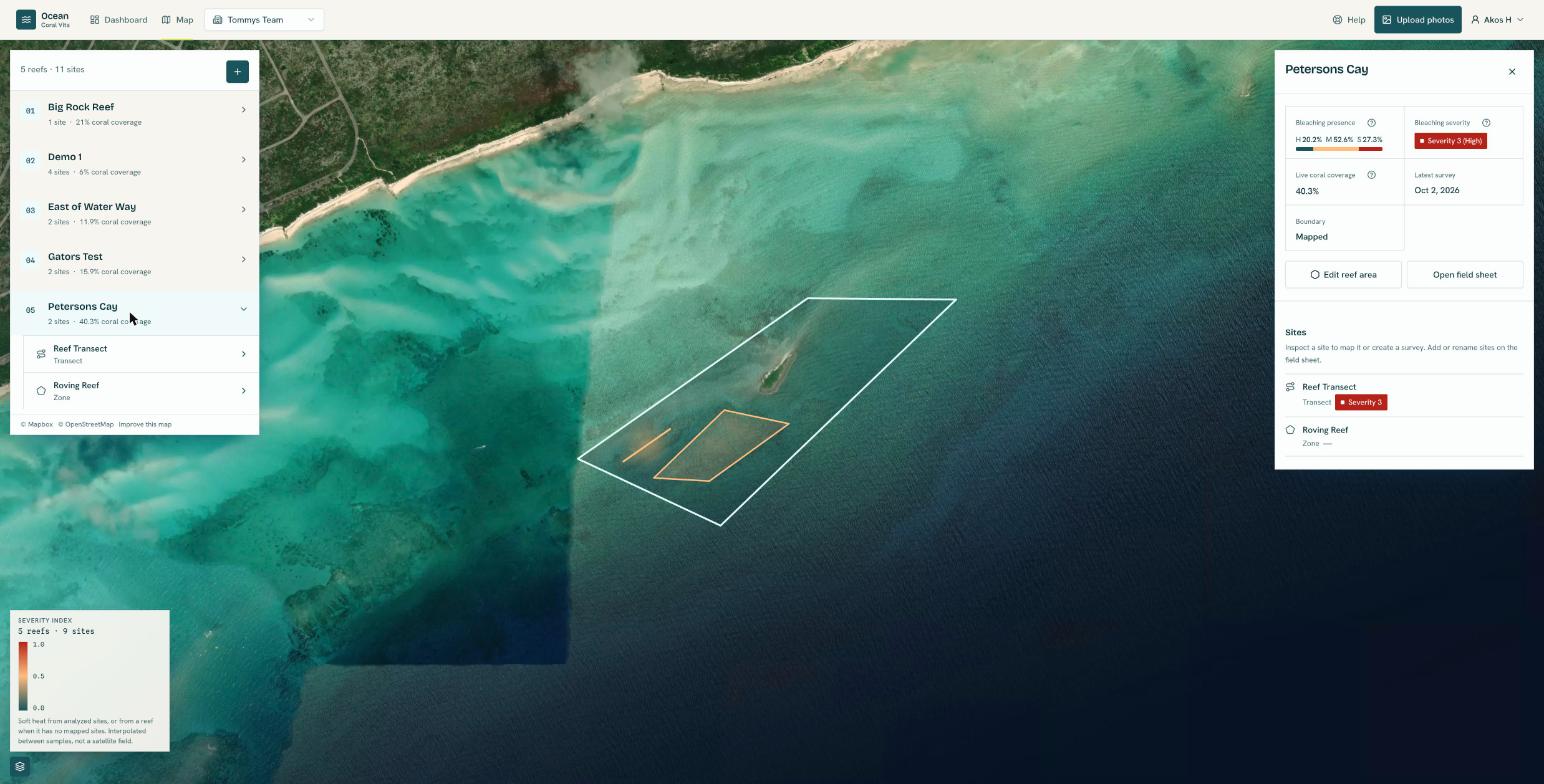
The Map shows your reefs and sites on satellite imagery. Select a reef or site to inspect it in the sidebar. From there you can map its area or location, create a survey, add photos, or start analysis.
Under Map layers, turn on Bleaching severity for a heatmap of the severity index across your analyzed sites, or across a reef when it has no mapped sites. Colours run from teal (0.0) through peach to red (1.0).